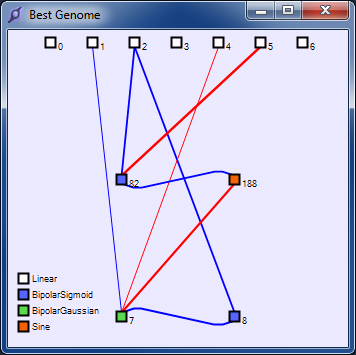
Here we see nodes coloured to indicate the CPPN activation function at each node.
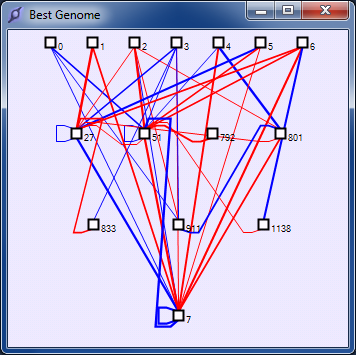
This screenshot shows a NEAT nework with moderate complexity.
Here we see something akin to a visual field of pixels. An input field accepts binary inputs, the pixels within the orange square outlines are set to 1, all other inputs to 0. An output field of the same size and resolution is connected up to the input field using an evolved CPPN to define the connectivity. In this animation we see how the activation level of the output pixels varies as we move the input pixels (orange boxes). The red pixel is the output pixel with the highest activation level.
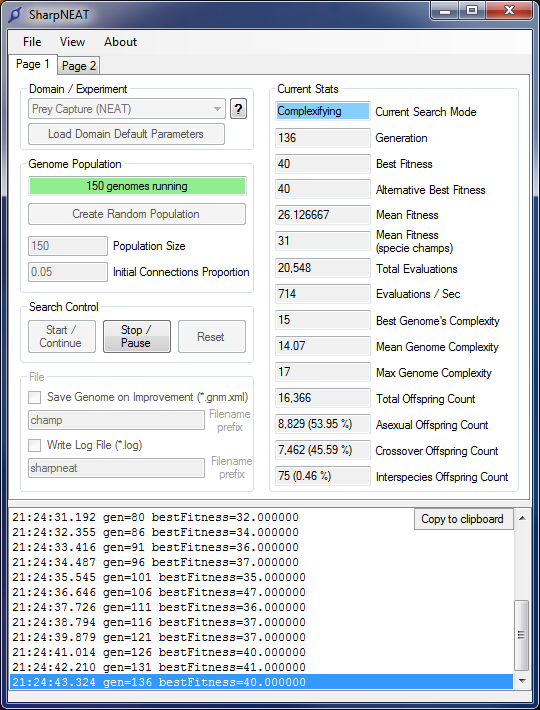
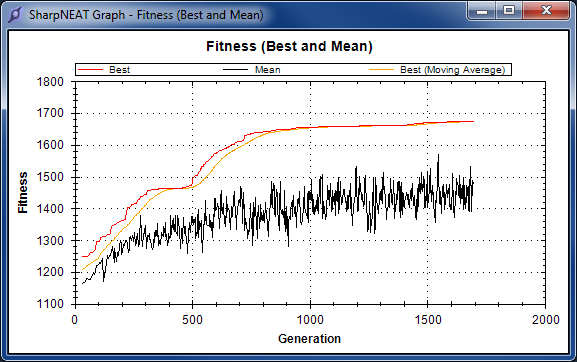
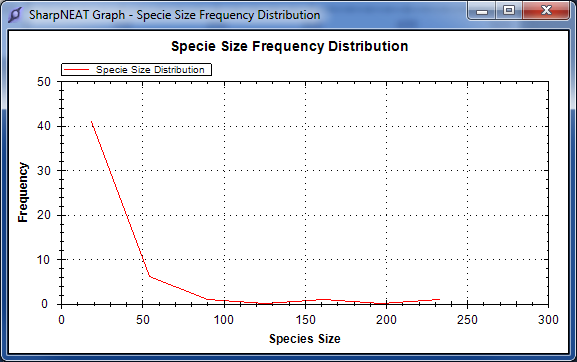
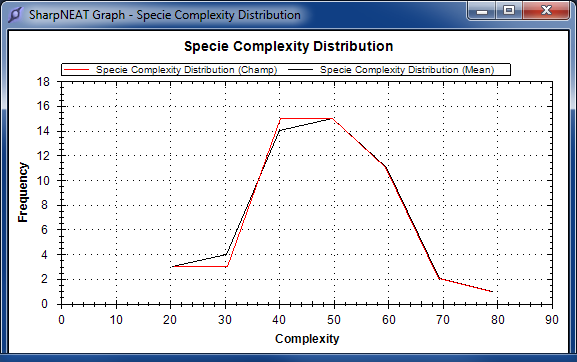
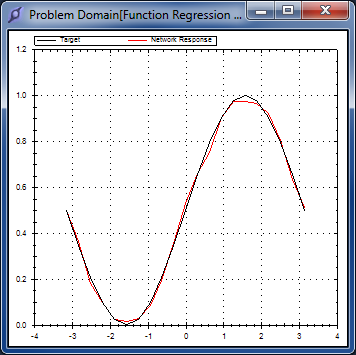
The graphs on this screen are drawn using the excellent free graphing control ZedGraph. Zedgraph supports panning and zooming.
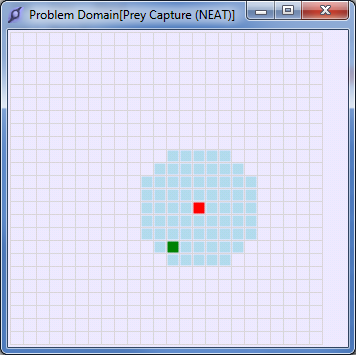
Here you can see the prey (green pixel) and our agent (red pixel) with its 8 radial sensor areas shown collectively as the blue region. The agent cannot see beyond the sensor range shown and thus must employ a search strategy before successfully using its sensor inputs to finally home in on the prey.
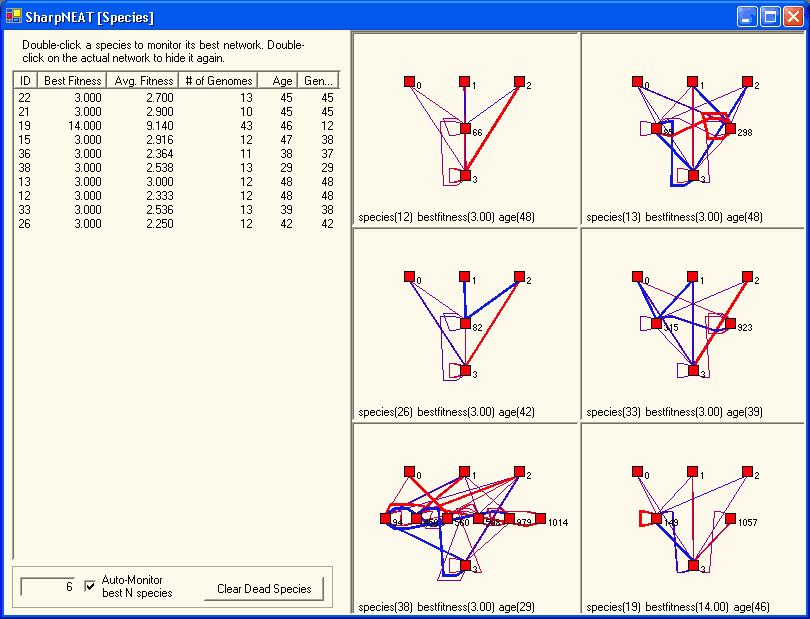
Species visualisation from SharpNEAT 1. Not currently present in SharpNEAT 2.
Here we see the tricky problem of double pole balancing and the even trickier problem of double pole balancing without a velocity input. Two poles attached to a cart can in fact be balanced if they are of different lengths. The lengths shown here are actually not representative - the short pole is actually much shorter but is shown longer to allow us to see its angle more clearly.