
Download: Release v2.4.3 on github
Version 2.4.3 is primarily a maintenance release. The main change in this release is a change to the default number of species in each experiment's configuration XML. Each experiment has had its default number of species changed to 10, which is a reduction for most of the experiments. This reduction generally results in improved performance across all experiments, in terms of execution speed and the best fitness achieved, on average, in a given amount of clock time.
The default speciation strategy since SharpNEAT 2.0 is based on k-means clustering applied to the connection genes of each genome (for more details see Speciation with K-Means Clustering). One side effect of using k-means is that the computational cost of speciation increases with (a) increased genome size, and (b) increased number of species. For some experiments the cost of performing speciation can become a significant proportion of the overall computational work in running a NEAT experiment, especially if fitness evaluation is relatively lightweight - which happens to be the case with the two current efficacy sampling experiments (Binary 11-multiplexer and Generative Sinewave).
In this release all experiments that specified a species count setting in their configuration XML have had that setting reduced to 10. This represents a reduction for most experiments, which previously used a range of species counts from 10 to 50. The two efficacy sampling experiments used a species of count of 40, so this release has reduced this value by a quarter of its previous value, and in turn this approximately reduces the amount of CPU time required to perform speciation by about the same proportion.
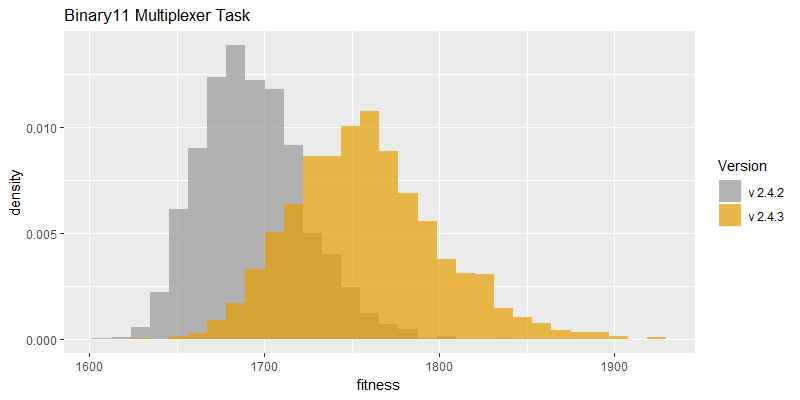
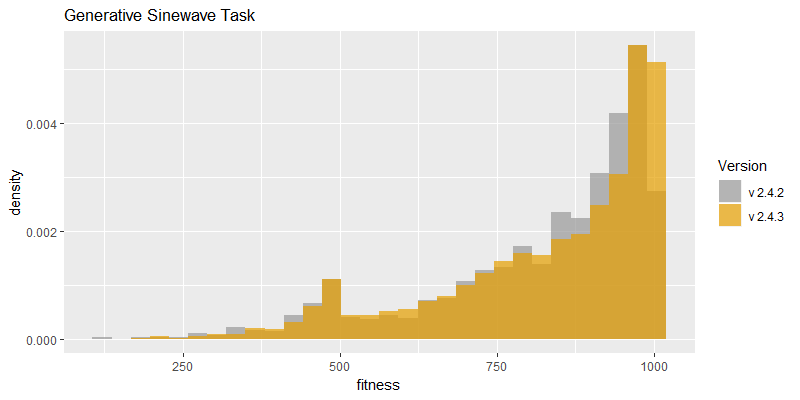
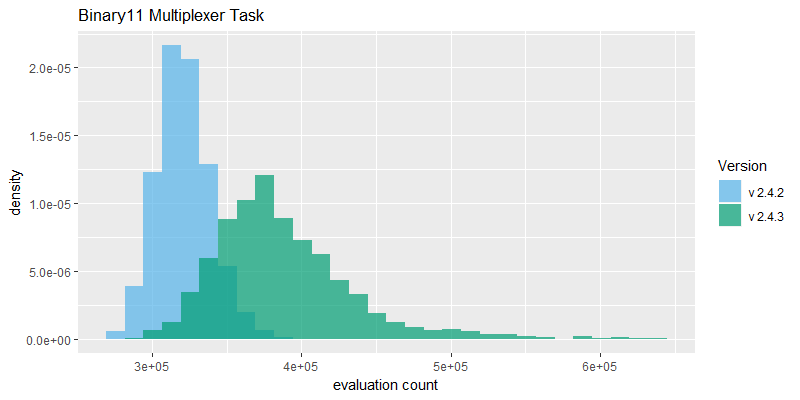
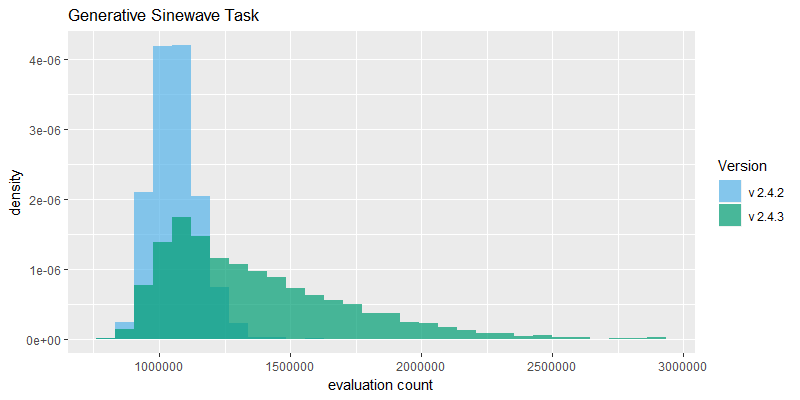
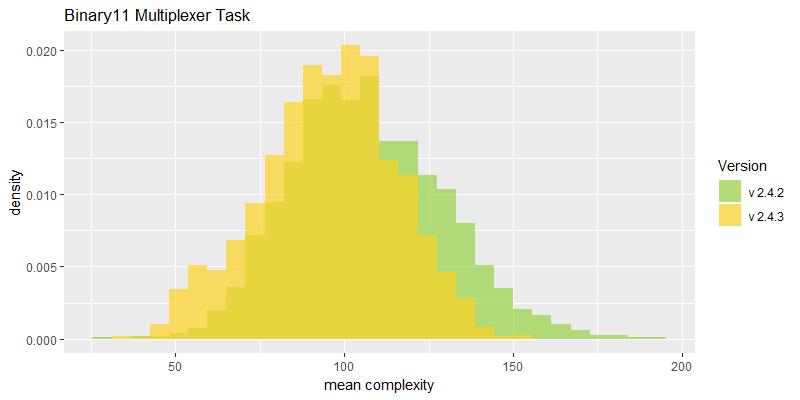
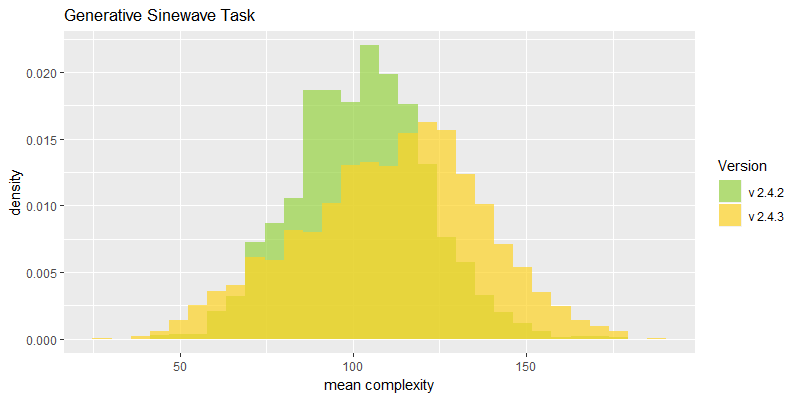
Efficacy sampling was performed on the two standard benchmark tasks and the results compared between this and the previous version (version 2.4.2). The resulting best fitness histograms are shown below. To recap, these histograms show the best fitness achieved on each of a large number of independent SharpNEAT runs, each of which terminates after one minute of execution (clock-time). Histograms are also provided comparing the evaluation counts achieved in each 60 second run, and (for the first time) mean genome complexity.
The reduction in species count from 40 to 10 has resulted in NEAT running faster overall, as evidenced by a significant shift to the right in the 'evaluation count' histograms, along with the emergence of a long right-hand tail. The Generative Sinewave task in particular actually has a much longer tail than is shown here, as 20 samples with evaluation counts between 3*10^6 and 8*10^6 have been removed from the 2.4.3 results to better show the main body of the histograms. These very high evaluation counts occur on the Generative Sinewave task partly because since v2.4.2 the evaluation code has been vectorized, and this coupled with the a very simple evaluation scheme overall means that this task can run very fast, e.g. compared to the Binary 11-multiplexer task which incorporates 2,048 neural net activations per evaluation.
Fitness scores are also much improved on the Binary 11-multiplexer task, as might be expected with the increased number of evaluations; noting that the maximum score on this task is 2,048 (=2^11). The Generative Sinewave task has a maximum score of 1,000, and therefore the histogram peak near that maximum is clearly showing that the maximum score is achieved in a high proportion of trials. Going forward it will likely be beneficial to switch to an alternative and more difficult task.
The new mean complexity histograms are based on population wide means calculated on the number of connection genes in each genome. The Generative Sinewave task shows a shift to the right, i.e. more complex genomes on average, as might be expected given that NEAT is able to perform more generations in each 60 second evaluation run. Interestingly though, the Binary 11-multiplexer task shows a reduction in complexity on average. One can only speculate on the dynamics that might cause this to occur, but perhaps the reduced number of species is resulting in less protection of variation within each population, and thus less complexity.
Colin,
July 29th, 2019
 Copyright 2019 Colin Green.